Buddy Logo
    • Advanced Search
  • Guest
    • Login
    • Register
    • Night mode
sandeep kumar Cover Image
User Image
Drag to reposition cover
sandeep kumar Profile Picture
sandeep kumar
  • Timeline
  • Groups
  • Likes
  • Friends
  • Photos
  • Videos
  • Reels
sandeep kumar profile picture
sandeep kumar
9 hrs - Translate

# **Power BI Finance Dashboard vs Excel Financial Reporting: Which One Truly Supports Modern Finance Teams?**

Financial reporting has always been at the core of business decision-making. For years, Excel has been the go-to tool for accountants, analysts, and finance managers. It’s familiar, flexible, and widely used across industries. But as businesses grow and financial data becomes more complex, traditional spreadsheets often struggle to keep up. That’s where Power BI steps in—offering interactive dashboards, real-time insights, and automated reporting that Excel simply cannot match.

Understanding the difference between a Power BI Finance Dashboard and Excel-based financial reporting is important for any organization aiming to boost efficiency, accuracy, and data-driven decision-making. Both tools serve a purpose, but their capabilities differ drastically.

---

## **How Excel Supports Financial Reporting**

Excel has been a trusted financial tool for decades. Finance teams rely on it for budgeting, forecasting, variance analysis, and day-to-day financial tasks. Its strengths mainly lie in its simplicity:

* Easy to use for basic calculations and data entry
* Flexible enough to build custom financial models
* Familiar interface understood by almost everyone in the finance world
* Great for quick analysis, pivot tables, and one-off reports

However, as financial data expands across multiple departments, systems, and formats, Excel starts to show limitations. Manual data entry increases the risk of errors. Version control becomes painful when multiple people share the same file. And static spreadsheets cannot offer interactive views or real-time updates.

This is where Excel begins to fall short for modern financial reporting needs.

---

## **Power BI Finance Dashboard: A Modern Approach**

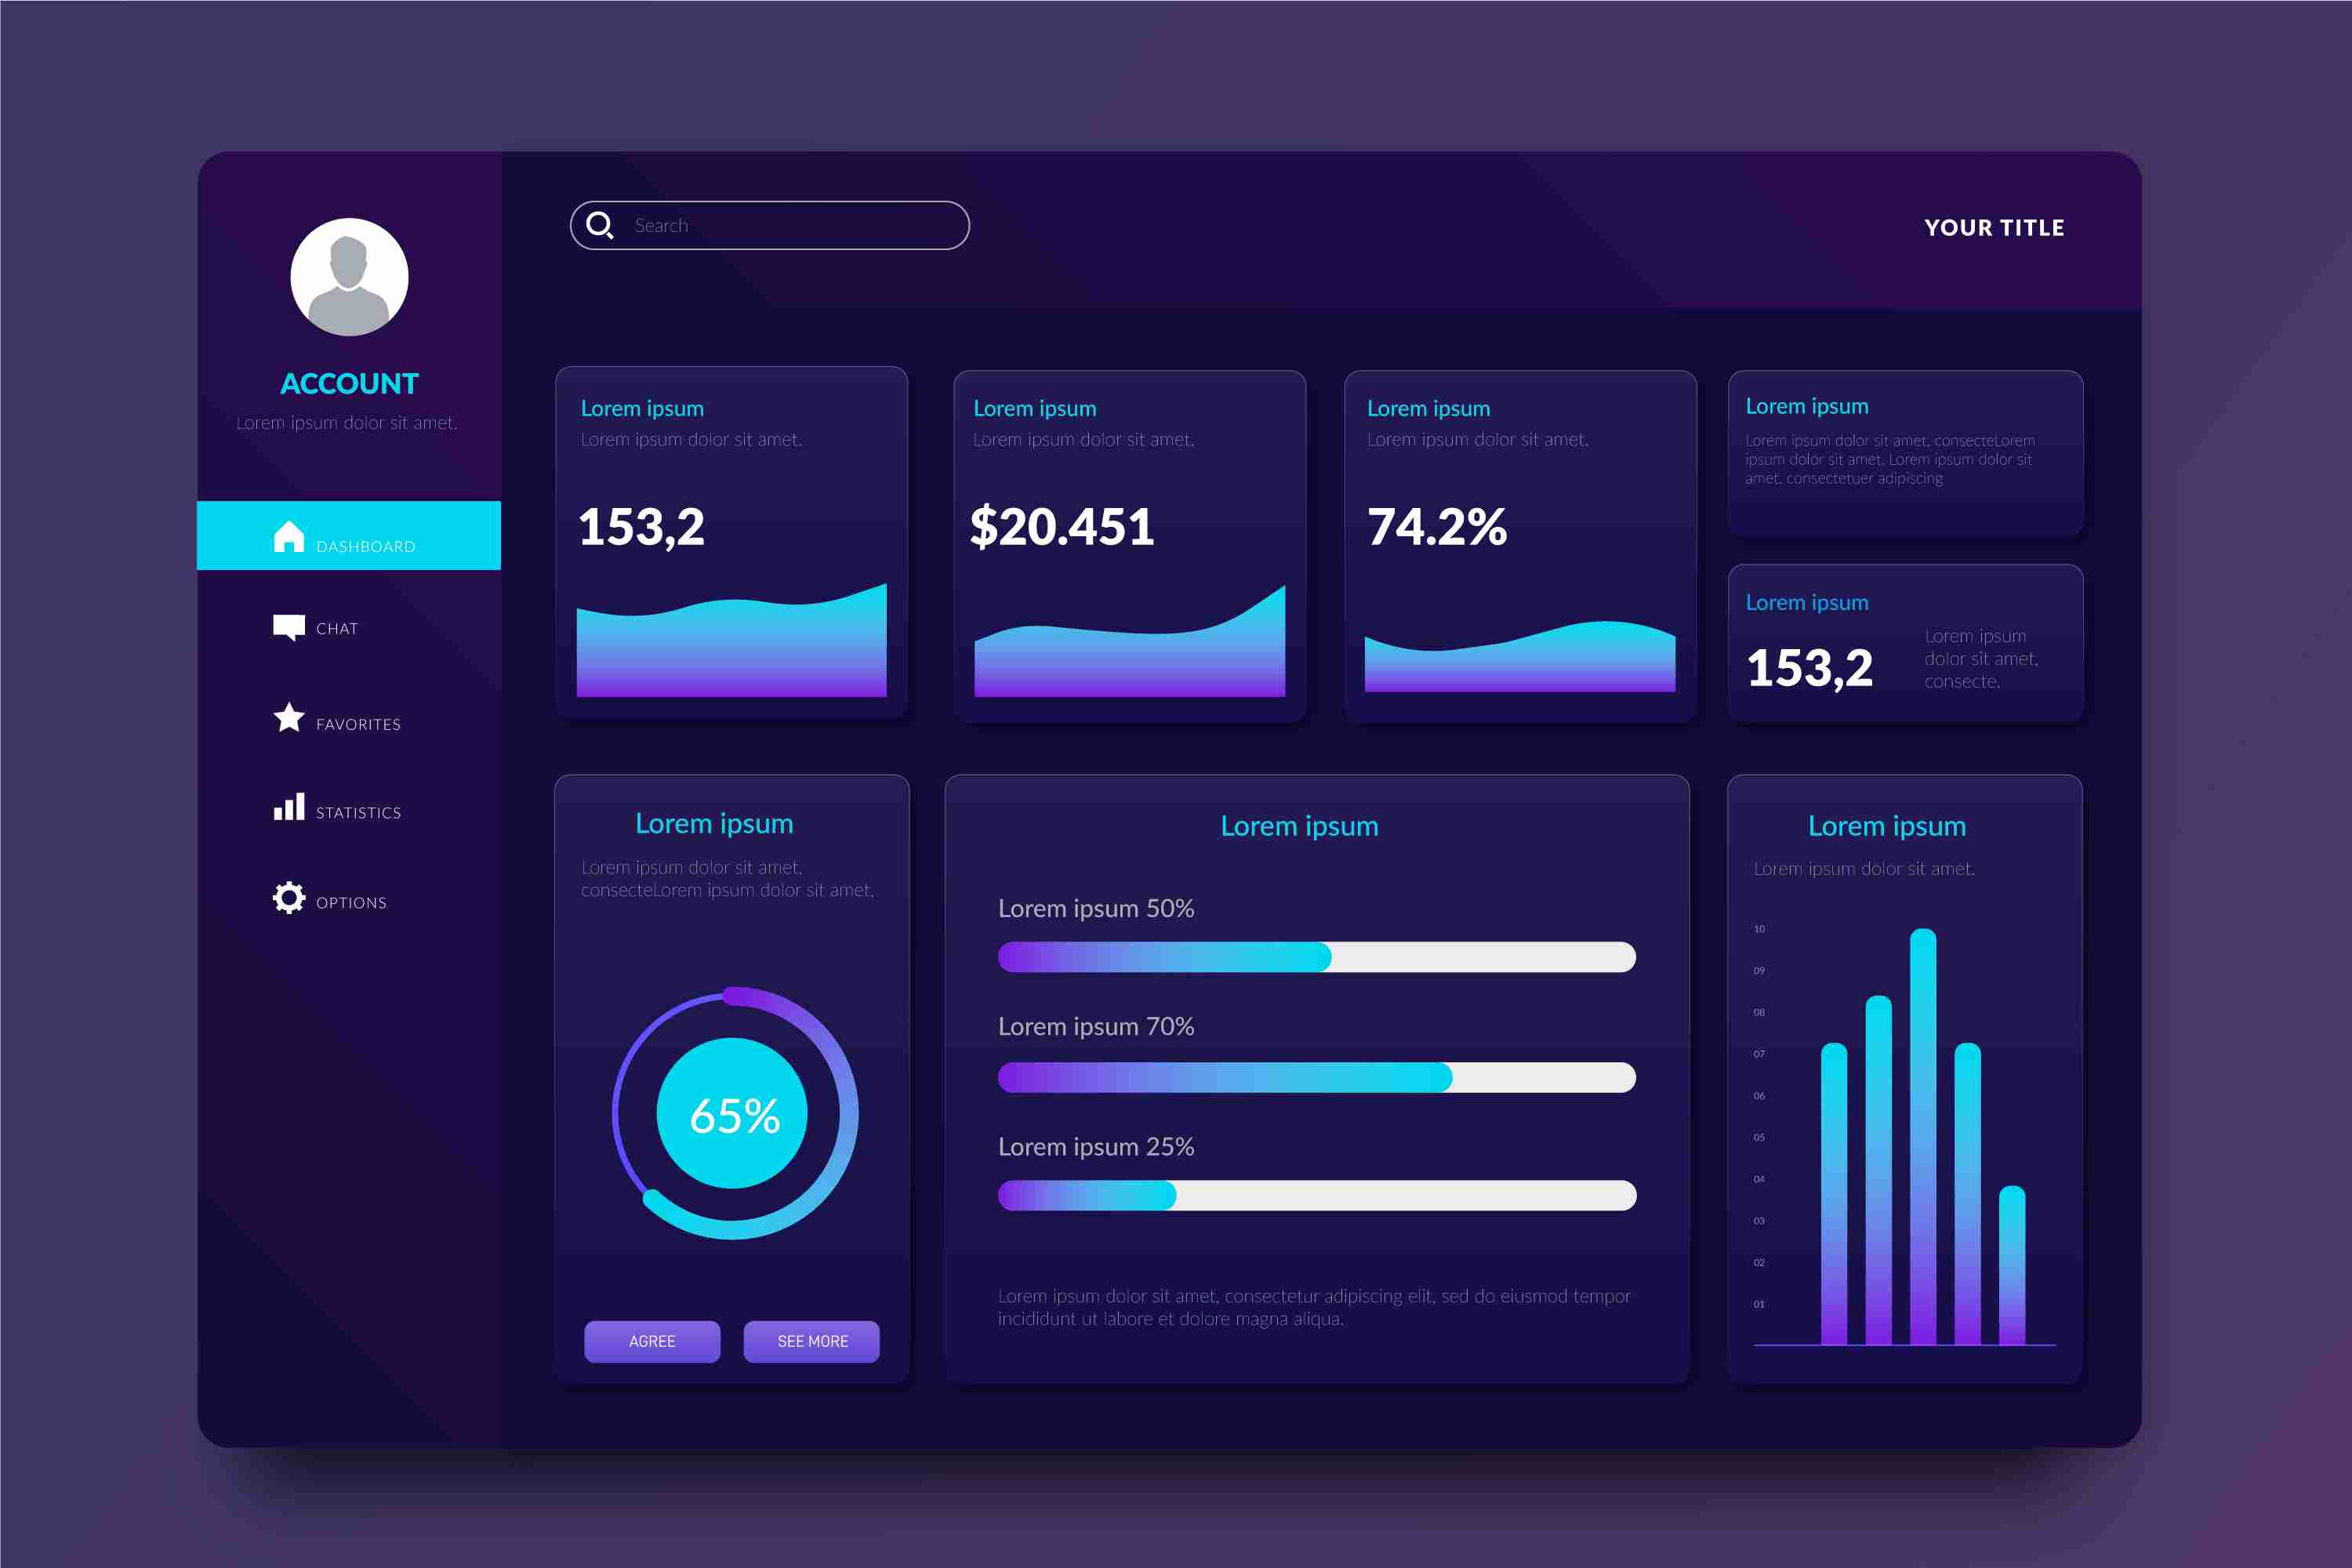
Power BI transforms financial reporting into a dynamic, visual, and automated process. Instead of working with multiple spreadsheet tabs, finance teams get a unified view that brings revenue, expenses, profit margins, cash flow, and KPIs into one interactive dashboard.

Key advantages include:

* Automated data refreshes from live sources
* Easy-to-read charts, visuals, and KPI indicators
* Drill-down analysis to understand trends in seconds
* Eliminates manual dependency and repetitive tasks
* Offers a single source of truth for all financial metrics

A Power BI Finance Dashboard doesn’t just present numbers—it tells a story. It allows stakeholders to explore data intuitively and uncover insights that are often hidden in spreadsheets.

---

## **Accuracy and Reliability: Power BI Wins**

One of the biggest challenges with Excel is the risk of human error. A wrong formula or an accidental deletion can break an entire report. Power BI minimizes this risk through:

* Centralized data models
* Standardized calculations
* Automated data cleaning
* Reduced manual intervention

Once a Power BI dashboard is set up, it updates automatically and maintains consistency across reports. This reliability makes it ideal for CFOs, financial controllers, and leadership teams who depend on accurate, up-to-date insights.

---

## **Data Visualization: The Clear Difference**

Excel offers charts, but they are limited and often become cluttered when dealing with large datasets. Power BI, on the other hand, is built for visualization:

* Interactive charts
* Drill-through options
* Dynamic filters
* Trend analysis
* Real-time KPI tracking

Finance teams can switch views, filter data instantly, and understand patterns more clearly. This creates better presentations, more informed decision-making, and deeper insight into business performance.

---

## **Collaboration and Sharing**

Excel files are usually shared through email, increasing the chances of using outdated versions. Power BI solves this by offering centralized dashboards accessible to authorized users anytime.

* No version mismatch
* Cloud-based dashboards
* Secure role-based access
* Real-time updates for everyone

This level of collaboration makes monthly, quarterly, and yearly reporting faster and smoother.

---

## **When Excel Is Still Useful**

Even with its limitations, Excel still has a place in finance:

* Quick ad-hoc reports
* Small datasets
* Simple calculations
* Early-stage startups with basic financial needs

However, as data grows and teams get bigger, the shift to automated and interactive tools becomes necessary.

---

## **Which Should You Choose?**

If your organization wants speed, accuracy, and deeper financial insight, Power BI clearly stands out. It reduces manual work, provides real-time views, and simplifies complex financial reporting tasks. Excel remains helpful, but it cannot match the intelligence and visualization capabilities offered by Power BI.

In the long run, combining both—Excel for quick analysis and Power BI for reporting—gives finance teams the strongest foundation for informed decision-making.
More Info:https://www.knowledgeexcel.com..../blogs/power-bi/powe

image
Like
Comment
Share
sandeep kumar profile picture
sandeep kumar
9 hrs - Translate

### **Interactive Data Visualization with Power BI**

In today’s world, businesses generate more data than ever before. Sales numbers, customer behaviour, marketing performance, website analytics, operational updates, financial trends — the list keeps growing. But raw data, no matter how valuable, cannot drive decisions on its own. What truly makes a difference is how clearly that data can be understood. That’s where interactive data visualization with Power BI becomes such a powerful advantage.

Gone are the days when companies relied only on static spreadsheets or long PDF reports. Modern organizations need dashboards that explain what’s happening right now, not what happened last month. Power BI makes this possible by converting complex datasets into clean, interactive visuals that anyone can explore and interpret.

---

## **Why Interactive Visualization Matters Today**

Static charts and long reports can show information, but they do not allow users to explore it. Interactive visualization changes this experience completely. It gives decision-makers the freedom to click, filter, drill down, compare, and uncover insights that would otherwise stay hidden.

When users engage with data, they naturally understand it better. For example, instead of seeing one fixed chart of sales performance, a manager can filter by region, compare months, or drill down into individual product categories. In seconds, they can find patterns, identify problems, or spot emerging opportunities.

This level of interactivity reduces guesswork and helps teams rely on data rather than assumptions. It also speeds up decision-making, as insights are available instantly — without waiting for new reports or updated spreadsheets.

---

## **How Power BI Elevates Data Visualization**

Power BI has become one of the most trusted platforms for interactive dashboards because it combines flexibility, power, and ease of use. Here’s what makes it stand out:

### **1. Smooth Data Integration**

Power BI connects to a huge range of data sources — Excel files, databases, cloud services, ERP systems, CRM tools, and more. This allows businesses to bring all their ****tered data into one unified view. Instead of checking different systems, users get a single dashboard that displays everything clearly.

### **2. Rich Visualization Options**

The platform includes a wide selection of charts, graphs, tables, maps, KPI cards, trend lines, and custom visuals. Each visual highlights data in a different way, allowing users to choose formats that best support their goals. Whether you need to track monthly performance, compare segments, or analyze patterns, Power BI offers visuals suited for every type of analysis.

### **3. Interactive Exploration**

This is where Power BI truly excels. With slicers, filters, drill-downs, and drill-through features, users can move from a high-level overview to detailed insights in a few clicks. Instead of seeing a single fixed view, they get a living dashboard that reacts to their choices.

### **4. Real-Time Updates**

Dashboards can refresh automatically. This means teams always see the most current data without manually pulling reports or updating files. For operations, finance, or sales teams, this real-time visibility is incredibly valuable.

### **5. Accessibility Across Devices**

Power BI dashboards work on desktops, laptops, tablets, and mobile phones. Leaders and teams can check insights anytime, from anywhere, ensuring that important decisions are never delayed.

---

## **What Makes an Interactive Dashboard Effective**

Creating a dashboard is not just about adding charts. A well-designed dashboard follows certain principles that make it powerful and easy to understand.

### **Clear Visuals**

Charts should be simple, clean, and focused on the message they are meant to deliver. Overloading a dashboard with too many visuals reduces clarity.

### **Logical Flow**

A dashboard should tell a story. For example, start with overall performance, then show trends, and finally provide detailed breakdowns. This structure helps users navigate naturally.

### **Consistency**

Using consistent colors, fonts, and formatting helps users read data quickly. It also makes dashboards look professional and easy on the eyes.

### **User-Centric Interactivity**

Interactive elements should feel natural and helpful. The goal is to let users find answers to their questions without confusion or technical knowledge.

---

## **Real-World Impact of Interactive Dashboards**

Interactive data visualization helps every department in an organization:

* **Sales teams** can monitor performance, check targets, and evaluate territory-wise performance.
* **Marketing teams** can track campaigns, compare channels, analyze customer journeys, and adjust in real time.
* **Operations** can monitor bottlenecks, quality trends, and process efficiency.
* **Finance teams** can track budgets, forecasts, expenses, and profitability across months or business units.

The biggest advantage is speed. Instead of waiting for analysts to prepare reports, teams can explore the data themselves. This empowers employees at all levels to make informed decisions.

---

## **How to Build a Strong Power BI Visualization Strategy**

To make the most of interactive visualization, businesses should follow a clear strategy:

1. Identify the key questions your dashboard should answer.
2. Gather and clean all required data.
3. Choose visuals that match the type of insight you want to deliver.
4. Add interactivity like filters and drill-down options.
5. Ensure dashboards are accessible to your team.
6. Train users so they can explore data confidently.

---

## **Conclusion**

Interactive data visualization with Power BI transforms raw information into meaningful insights. It helps businesses move from reactive reporting to proactive decision-making. By offering real-time data, intuitive visuals, and powerful interactivity, Power BI allows teams to understand trends, identify challenges, and respond faster than ever.

In a world where data drives competition, interactive dashboards give companies the clarity, speed, and confidence they need to stay ahead — and Power BI stands at the center of this transformation.
More Info:https://www.knowledgeexcel.com..../blogs/data-visualiz

Interactive Data Visualization with Power BI | Knowledge Excel

Unlock deeper insights with interactive data visualization powered by Power BI. Explore how Knowledge Excel builds dynamic dashboards for Finance, HR, and Survey analytics to transform data into actionable intelligence.
Like
Comment
Share
sandeep kumar profile picture
sandeep kumar
9 hrs - Translate

### Power BI Finance Dashboard — A Smart Financial Command Center

In today’s fast-moving business world, finance teams no longer have the luxury of pouring over spreadsheets day after day to bring together numbers from multiple departments. They need a tool that can gather data quickly, keep it updated, and present it in a way that business leaders can instantly understand. That’s what a **Power BI Finance Dashboard** is for — a centralized, interactive platform that turns raw financial data into actionable insight.

#### What Exactly Is a Power BI Finance Dashboard?

A Power BI Finance Dashboard is essentially a visual analytics solution. It pulls in financial data from different sources — ERP systems, accounting tools, CRM platforms, legacy databases, spreadsheets — and unifies them in one place.

Once all the data is connected, the dashboard offers a real-time window into key business metrics: revenue, expenses, profit margins, cash flow, and more. Users can monitor these figures continuously, spot trends, flag anomalies, and analyze cost drivers without manually reconciling spreadsheets. In short, it becomes a “financial command center,” trusted by executives, analysts, and controllers alike.

#### The Advantages: Why Finance Teams Should Embrace It

There are several powerful reasons why finance teams benefit from using Power BI dashboards instead of traditional spreadsheet-based reporting.

* **Instant KPI tracking* Dashboards let users view critical financial indicators like net income, EBITDA, gross margin, operating ratios and cash flow at a glance.
* **Faster, more reliable reporting* Month-end, quarter-end or annual reports which formerly took days — and were prone to manual errors — can now be generated swiftly and accurately.
* **Better cost control & forecasting* With a clear view of spending patterns, expense drivers and cash flow, organizations can identify inefficiencies, control costs, plan budgets more wisely and forecast future performance using trend data or built-in predictive analytics.
* **Unified, scalable data integration* Because Power BI can draw data from ERP software, databases, cloud services, spreadsheets — even legacy systems — it supports unified reporting across departments and business units, without sacrificing performance.
* **Interactive, intuitive visuals* Rather than sifting through long Excel tables, users can digest data via charts, graphs, KPI cards, trend lines — and explore the details by drilling down.

In short, a Power BI Finance Dashboard elevates the finance team from “number crunchers” to strategic decision partners.

#### Typical KPIs & Financial Metrics You Can Track

What can you actually track on a finance dashboard? The set of metrics depends on your business goals — but typically includes:

* **Revenue and Cost of Goods Sold (COGS)* Compare topline revenue with direct costs to identify profitable products or services, and spot where costs can be optimized.
* **Gross and Net Profit, Margins* Understand profitability at both overall and divisional levels, enabling data-driven decisions around pricing, cost control, and resource allocation.
* **Operating Expenses* Break down overheads, departmental or project-level expenses — see trends in spending, highlight overspending and spot cost-saving opportunities.
* **Budget vs. Actuals* Compare actual performance against budgeted targets. Highlight variances clearly so corrective actions can be taken in time.
* **Liquidity & Cash Flow Metrics* Track cash reserves, working capital, current ratio — monitor cash inflows and outflows, manage receivables and payables, and ensure short-term financial stability.
* **Accounts Receivable & Payable* Visualize ageing, payment cycles — get a clear view of incoming and outgoing payments for better cash-flow management.
* **Return on Investment (ROI) and Profitability Ratios* Assess how well capital is deployed across projects or departments; compare returns to investment to guide strategic decisions.

These dashboards can be shaped according to the organization’s needs — whether a senior executive wants an “at-a-glance” summary, or a controller wants a deep dive into cost centers and variances.

#### Best Practices for Building Effective Finance Dashboards

A dashboard is only as useful as its design. Here are some best practices to ensure it delivers value:

* **Know your audience* Executives, controllers, analysts — each needs a different view. Tailor dashboards accordingly.
* **Tell a clear financial story* Design dashboards to follow a logical flow — from revenue to costs, profit, margins, and cash flow. This narrative helps stakeholders understand business health at a glance.
* **Keep it simple* Resist the urge to add every possible chart. Focus on essential metrics that matter for decision-making. Use clean, uncluttered visuals to avoid confusion.
* **Use consistent visuals* Standardize colors, fonts, chart types. This helps users interpret data quickly and reliably, even across multiple dashboards or departments.
* **Ensure data security and governance* Financial data is often sensitive. Use role-based access, audit trails, encryption, and strict controls to maintain confidentiality and compliance.

#### Why Power BI Stands Out Compared to Traditional Tools

Traditional spreadsheet tools like Excel — though familiar — have limitations. As data volumes grow, spreadsheets become slow, error-prone, and difficult to manage across multiple users or teams.

In contrast, Power BI offers:

* Better scalability — it can handle millions of records with ease, thanks to its efficient data engine.
* Automated and real-time data refresh — dashboards remain up-to-date without manual intervention.
* Rich interactivity and drill-down capabilities — users can explore data dynamically.
* Strong integration with existing ecosystems — whether ERP software, cloud databases, CRMs, or spreadsheets.
* Secure sharing and collaboration — dashboards can be shared securely via web, teams, or embedded portals.

All these make Power BI a far more robust, flexible, and business-friendly tool than traditional static reporting.

#### In Conclusion

A Power BI Finance Dashboard is far more than a just report — it’s a financial nerve center. By centralizing data, automating updates, and presenting insights via intuitive visuals, it helps finance teams evolve from routine number crunching to strategic partners driving business decisions.

Whether you are a CFO wanting high-level clarity, a controller monitoring departmental spend, or an analyst digging into cash flow and cost-centres, a thoughtfully designed Power BI dashboard can become your most valuable tool.

Investing time to define your KPIs, design a clean layout, and secure data governance will pay off many times over. In a time when agility, accuracy, and clarity matter more than ever, Power BI Finance Dashboard stands out as the smarter way to track financial health and plan for sustainable growth.

image
Like
Comment
Share
sandeep kumar profile picture
sandeep kumar
11 hrs - Translate

# **Power BI Finance Dashboards: A Smarter Way to Understand Your Financial Data**

Managing financial data is one of the most critical responsibilities in any business, no matter the size. While spreadsheets have helped teams track numbers for years, they tend to become messy, slow, and unreliable as the business grows. This is where a Power BI finance dashboard becomes a game-changer. It gives businesses a clean, visual, and interactive way to understand financial performance without digging through endless rows of numbers.

A Power BI finance dashboard is essentially a centralized platform that pulls financial data from multiple sources and converts it into easy-to-understand visual insights. These dashboards are widely used to track revenue, expenses, profit margins, cash flow, budgets versus actuals, accounts receivable, and many other key financial indicators. Instead of manually preparing reports, businesses get everything updated automatically in one place.

---

## **Why Power BI Finance Dashboards Matter**

### **1. Real-Time Visibility**

One of the biggest advantages of a Power BI finance dashboard is its ability to show real-time or near real-time data. When financial information updates instantly, decision-makers don’t have to wait for monthly reports. They can spot irregularities, track spending patterns, and make informed decisions quickly. This is especially helpful for businesses that experience frequent transactions and need constant clarity on cash flow.

### **2. Consolidates Data from Multiple Sources**

Most businesses don’t store financial information in one place. Some numbers may live in accounting software, others in sales tools, and many in spreadsheets. A Power BI dashboard gathers all this information into one clean, unified view. This gives leadership a complete picture of the company’s financial health without switching between tools.

### **3. Reduces Manual Reporting Errors**

Manual financial reporting is time-consuming and prone to mistakes. Whether it’s wrong formulas, broken cells, or outdated sheets, errors can easily go unnoticed. Power BI eliminates these risks by automating data refreshes and reporting. This not only increases accuracy but also frees up finance teams to focus on analysis rather than manual data work.

### **4. Visual Insights That Improve Understanding**

Financial data can be overwhelming when presented as raw numbers. Dashboards simplify analysis by using visual elements like charts, graphs, KPI cards, and trend lines. These visuals help users spot trends, identify problems, and compare performance quickly. With the ability to drill down into specific categories or periods, understanding financial details becomes effortless.

### **5. Better Forecasting and Budget Management**

A well-structured dashboard is not limited to showing current performance. It also helps businesses compare budgets with actual performance, analyze variances, and forecast upcoming financial results. These insights are crucial for planning investments, managing expenses, and setting realistic business goals.

---

## **Key Metrics Tracked in a Finance Dashboard**

Finance dashboards can be tailored for different teams and business sizes. However, the most common metrics include:

* **Revenue**
* **Gross and Net Profit Margins**
* **Operating Expenses**
* **Cash Flow and Liquidity Ratios**
* **Budget vs Actual Performance**
* **Accounts Receivable and Payable Aging**
* **Project or Product Profitability**
* **Cost of Goods Sold (COGS)**
* **Department-Wise Spending**

By tracking these KPIs in one place, businesses gain complete financial transparency and can act before small issues turn into larger problems.

---

## **Why Power BI Outperforms Traditional Spreadsheets**

Spreadsheets work well for small datasets, but they struggle with:

* Large data volumes
* Complex financial models
* Collaborative reporting
* Real-time updates
* Consistent formatting

Power BI handles all of these easily. It processes large datasets smoothly, updates automatically, and lets users explore data through interactive visuals. Dashboards stay consistent, clear, and accessible across teams. They can also be secured with role-based access, ensuring sensitive financial data stays protected.

---

## **Best Practices for Designing Effective Finance Dashboards**

To make dashboards useful and reliable, a few good practices should be followed:

### **1. Understand the Audience**

A CFO may need high-level summaries, while analysts require more detailed drill-downs. Knowing the user helps create the right layout and depth.

### **2. Keep the Design Clean and Minimal**

Too many visuals can overwhelm the viewer. A good dashboard focuses on key metrics and presents them clearly.

### **3. Use Standardized Labels and Colors**

Consistent formatting helps users navigate the dashboard easily and avoids confusion.

### **4. Enable Interactive Elements**

Filters, drill-downs, and comparison tools make dashboards far more powerful and flexible.

### **5. Automate Data Refresh**

Setting up scheduled refreshes ensures that reports remain accurate without any manual effort.

### **6. Ensure Data Security**

Financial data is sensitive, so dashboards must have proper access controls and security measures.

---

## **Who Can Benefit from a Finance Dashboard?**

Finance dashboards benefit a wide range of businesses, including:

* Small and medium-sized businesses
* Large enterprises with multiple departments
* E-commerce or retail stores
* Service-based companies
* Startups tracking growth and investor funds

In short, any organization that works with numbers and wants reliable insights can gain value from a Power BI finance dashboard.

---

## **Conclusion**

A Power BI finance dashboard is more than a reporting tool — it’s a strategic asset. It brings financial clarity, reduces manual workloads, strengthens accuracy, and empowers companies to make smarter decisions. With real-time insights, consolidated data, forecasting capabilities, and intuitive visuals, it helps businesses stay ahead in a fast-changing financial environment. For organizations looking to sharpen their financial strategy, adopting a Power BI finance dashboard is a powerful step forward.
More Info:https://www.knowledgeexcel.com..../power-bi/finance-da

image
Like
Comment
Share
sandeep kumar profile picture
sandeep kumar
11 hrs - Translate

# **Power BI Finance Dashboard vs Excel Financial Reporting: Which One Drives Better Financial Decisions?**

For years, Excel has been the backbone of financial reporting. Every finance team relied on spreadsheets to track budgets, analyze revenue, and prepare monthly or quarterly reports. But as businesses grow, so do their data needs. Today, leaders want fast insights, real-time visibility, and accurate forecasts—something traditional spreadsheets often struggle to deliver efficiently. This is where modern tools like Power BI step in, offering a deeper, more dynamic way to understand financial performance.

Both Excel and Power BI have strong capabilities, but they serve different purposes. Understanding their differences helps teams choose the right approach for better clarity, collaboration, and decision-making.

---

## **Why Excel Still Matters in Financial Reporting**

Excel remains popular because it is familiar, flexible, and widely accessible. Finance professionals trust it for calculations, scenarios, pivot tables, and custom reports. It offers full control over formulas, formatting, and layout, allowing teams to build exactly what they need.

Excel is especially useful when:

* You need quick, manual calculations
* Working on small datasets
* Preparing simple financial statements
* Sharing offline reports
* Performing ad-hoc analyses

However, as data grows, Excel can become slow, cluttered, and difficult to maintain. Manual updates often increase the risk of errors, and collaborating across teams can turn into a challenge. Version control becomes messy, and tracking changes requires extra effort. When companies need automation and real-time insights, Excel alone may not be enough.

---

## **How Power BI Transforms Financial Analysis**

Power BI is designed for large datasets, continuous updates, and interactive visualization. Instead of static spreadsheets, you get dynamic dashboards that can pull data from multiple sources in seconds. This eliminates repetitive manual work and ensures that leaders always see the latest numbers.

Key strengths of Power BI include:

* Automated data refresh
* Real-time dashboards
* Drill-down insights
* Forecasting and trend analysis
* Customizable visuals for KPIs
* Easy sharing across teams

With Power BI, financial teams can turn monthly reporting into a smooth, automated workflow. Instead of downloading spreadsheets and preparing charts manually, users get dashboards that update themselves. This saves significant time and reduces the chances of manual errors.

---

## **Comparing Both: Where Each Tool Shines**

### **1. Data Handling**

Excel is ideal for smaller datasets and short-term work. Power BI handles large and complex data with ease and connects to multiple sources without slowing down.

### **2. Automation**

Excel requires manual updates. Power BI refreshes data automatically, providing real-time financial insights.

### **3. Visualization**

While Excel offers charts and pivot tables, Power BI provides advanced dashboards that allow interactions, filters, and deeper exploration of financial trends.

### **4. Collaboration**

Sharing Excel reports often creates multiple versions. Power BI offers a centralized dashboard, ensuring everyone sees the same updated information.

### **5. Accuracy**

Excel's manual inputs increase the risk of mistakes. Power BI minimizes errors by automating data pulls and calculations.

---

## **How Power BI Improves Financial Decision-Making**

Power BI gives leaders a clear financial picture without digging through spreadsheets. Decision-makers can instantly understand revenue patterns, expenses, profitability, and performance indicators through intuitive visuals. If something changes—like sudden dips in cash flow or rising operational costs—Power BI highlights it in real time.

With this level of visibility, finance teams can:

* Identify trends early
* Respond faster to risks
* Increase reporting accuracy
* Support better strategic planning

Power BI also allows scenario modeling. For example, businesses can evaluate how a price change, cost shift, or seasonal trend might affect revenue. This makes planning more reliable and future-focused.

---

## **Where Excel Still Has an Edge**

Even with Power BI’s strengths, Excel remains critical for:

* Detailed financial modeling
* Complex formula-based calculations
* One-time analyses
* Customized reports requiring manual logic
* Flexibility needed by experienced analysts

In many organizations, Excel and Power BI complement each other. Financial data can be prepared in Excel and visualized in Power BI, creating a seamless workflow.

---

## **Which One Should You Choose?**

There's no one-size-fits-all answer—it depends on your needs. If your reports are simple and your team is small, Excel is enough. But if your organization requires real-time insights, automated reporting, and the ability to analyze large datasets quickly, Power BI is a more powerful choice.

Most modern companies use both: Excel for modeling and Power BI for visualization and automation. This combination balances flexibility with efficiency, giving finance teams the tools they need to work smarter and deliver better results.

---

## **Conclusion**

The shift from traditional Excel reporting to dynamic Power BI dashboards reflects how businesses today expect faster, clearer, and more accurate financial insights. Excel will always remain a trusted tool for analysts, but Power BI takes financial reporting to the next level by simplifying data, automating updates, and offering interactive analytics. Together, they help finance teams adapt to growing demands and support better decision-making in a data-driven world.
More Info:https://www.knowledgeexcel.com..../blogs/power-bi/powe

image
Like
Comment
Share
 Load more posts
    Info
  • 22 posts

  • Male
  • 14-11-02
  • Living in India
    Albums 
    (0)
    Friends 
    (0)
    Likes 
    (1)
  • buddy
    Groups 
    (0)

© 2025 Buddy

Language

  • About
  • Directory
  • Blog
  • Contact Us
  • Developers
  • More
    • Privacy Policy
    • Terms of Use
    • Request a Refund
    • User Feedback
    • Payout Policy
    • Payment Policy
    • Community Guidelines
    • User-Generated Content Policy
    • Data Privacy
    • Buddy - Frequently Asked Questions (FAQ)

Unfriend

Are you sure you want to unfriend?

Report this User

Important!

Are you sure that you want to remove this member from your family?

You have poked 1760339011435522_9463

New member was successfully added to your family list!

Crop your avatar

avatar

Enhance your profile picture

Available balance

0

Images


© 2025 Buddy

  • Home
  • About
  • Contact Us
  • Privacy Policy
  • Terms of Use
  • Request a Refund
  • Blog
  • Developers
  • More
    • User Feedback
    • Payout Policy
    • Payment Policy
    • Community Guidelines
    • User-Generated Content Policy
    • Data Privacy
    • Buddy - Frequently Asked Questions (FAQ)
  • Language

Comment reported successfully.

Post was successfully added to your timeline!

You have reached your limit of 50000000000000000 friends!

File size error: The file exceeds allowed the limit (244 MB) and can not be uploaded.

Your video is being processed, We’ll let you know when it's ready to view.

Unable to upload a file: This file type is not supported.

We have detected some adult content on the image you uploaded, therefore we have declined your upload process.

Share post on a group

Share to a page

Share to user

Your post was submitted, we will review your content soon.

To upload images, videos, and audio files, you have to upgrade to pro member. Upgrade To Pro

Edit Offer

0%

Add tier


Select an image
Delete your tier
Are you sure you want to delete this tier?

Reviews

In order to sell your content and posts, start by creating a few packages. Monetization

Pay By Wallet

Delete your address

Are you sure you want to delete this address?

Remove your monetization package

Are you sure you want to delete this package?

Unsubscribe

Are you sure you want to unsubscribe from this user? Keep in mind that you won't be able to view any of their monetized content.

Remove your monetization package

Are you sure you want to delete this package?

Payment Alert

You are about to purchase the items, do you want to proceed?
Request a Refund

Language

  • Arabic
  • Bengali
  • Chinese
  • Croatian
  • Danish
  • Dutch
  • English
  • Filipino
  • French
  • German
  • Hebrew
  • Hindi
  • Indonesian
  • Italian
  • Japanese
  • Korean
  • Persian
  • Portuguese
  • Russian
  • Spanish
  • Swedish
  • Turkish
  • Urdu
  • Vietnamese